
How to visualize data from a CSV file in React(Full code on Github)
A CSV is a Comma Separated Value file that stores tables data. In this step-by-step tutorial, we will be generating a line graph given a simple CSV file.
The prerequisites for this tutorial are knowledge in: React Hooks, Arrays and ES6.All the code is provided on Github. Incase of comments or questions contact me on my social media handles or via email.
To start with, lets create a simple CSV file using the following data:
date, amount, spent
2019–01–01, 10, 100
2019–01–02, 20, 200
You can as well use your own values for date, amount and spent.
Now that we’ve created a simple CSV file, lets create a textbox where we will paste our simple CSV file content.
Converting a CSV string to an array
To parse data in a CSV file, we will need to import a csv library.
import * as CSV from "csv-string";Process the data
At this point, we will need a button to read the CSV data pasted in the textarea. When the button is clicked, it should automatically read the headers(date, amount, spent) and put those variables in the dropdown box.
In order to connect data points in a line graph, we will need to generate values for the horizontal axis(X-axis) and vertical axis(Y-axis). For this, we will create two drop down boxes for the X and Y axis to populate the column names(date, amount, spent).
The idea is to get headers(date, amount, spent) from the CSV file, remove them from the list and update the array with the other array values.
The array provided is a nested array. This means that we need to iterate through the array to get the header values, then get the values of the array with the same index as the header and push the new array items to the new list(refinedList) in this case.
With that in mind, lets break it down.
- Parse CSV string into an array.
- Get the headers from the list(date, time, spent)
- Remove the headers from the list.
- Get the values for each column, i.e. the headers and return their values(date=[0], amount=[1], spent=[2]).
- Get items from the array with the same index as the header(date is at index 0 which means that 2019–01–01 is at index 0).
- Push the array items to the columns of the new array.
- Update the state of the array.
The dropdown boxes should now contain all the column values(date, amount, spent). To illustrate our array items, we will add a button that will generate a line graph when the values in the X and Y axis are selected.
Line Graph
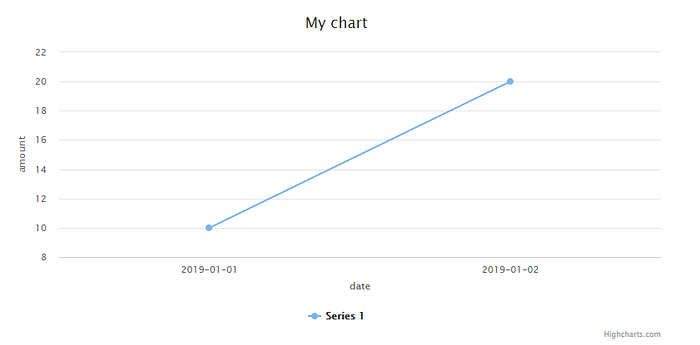
Finally, we will use highcharts to generate our simple line graph. Highcharts is a javascript library for creating interactive charts that can be used in your web projects. I encourage you to explore this library since it is efficient and easy to configure and use.
The following code shows how easy it is to visualize our array data using highCharts.
Output:
I’m glad you made it this far!. Share your thoughts below. Happy hacking!
